plt, sb 차트를 streamlit 에서 표시하려면
1. plt.figure() 로 먼저 영역을 잡아주고
2. st.pyplot() 함수로 웹 화면에 그려준다
import streamlit as st
import pandas as pd
import matplotlib.pyplot as plt
import seaborn as sb
def main():
st.title('차트 그리기')
df = pd.read_csv('./data/iris.csv')
st.dataframe(df)
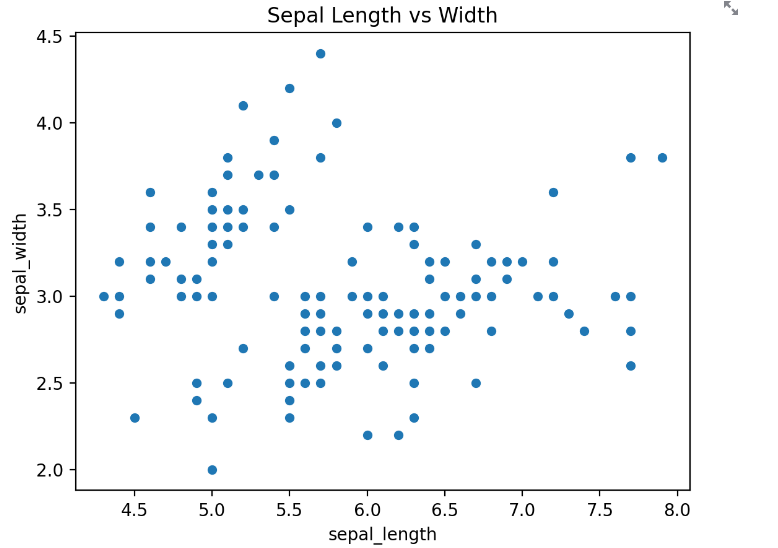
# sepal_length 와 sepal_width 의 관계를 차트로 나타내시오.
fig1 = plt.figure()
plt.scatter(data=df, x='sepal_length', y='sepal_width')
plt.title('Sepal Length vs Width')
st.pyplot(fig1)
fig2 = plt.figure()
sb.scatterplot(data=df, x='sepal_length', y='sepal_width')
plt.title('Sepal Length vs Width')
st.pyplot(fig2)
fig3 = plt.figure()
sb.regplot(data=df, x='sepal_length', y='sepal_width')
plt.title('Sepal Length vs Width')
st.pyplot(fig3)
# sepal_length 로 히스토그램을 그린다.
# bins 의 갯수는 20개
fig4 = plt.figure()
plt.hist(data=df, x='sepal_length', bins=20, rwidth=0.9)
plt.title('Histogram')
plt.xlabel('sepal_length')
plt.ylabel('count')
st.pyplot(fig4)


'Python > Streamlit' 카테고리의 다른 글
| [Python] Streamlit plotly 차트 (1) | 2024.04.24 |
|---|---|
| [Python] Streamlit 차트 그리기 line_chart, area_chart, bar_chart, map (0) | 2024.04.24 |
| [Python] Streamlit 파일 분리 처리 (0) | 2024.04.24 |
| [Python] Streamlit 파일 업로드 (0) | 2024.04.24 |
| [Python] Streamlit 유저한테 데이터 입력 받기 (0) | 2024.04.23 |